Dashboard Access Statistics
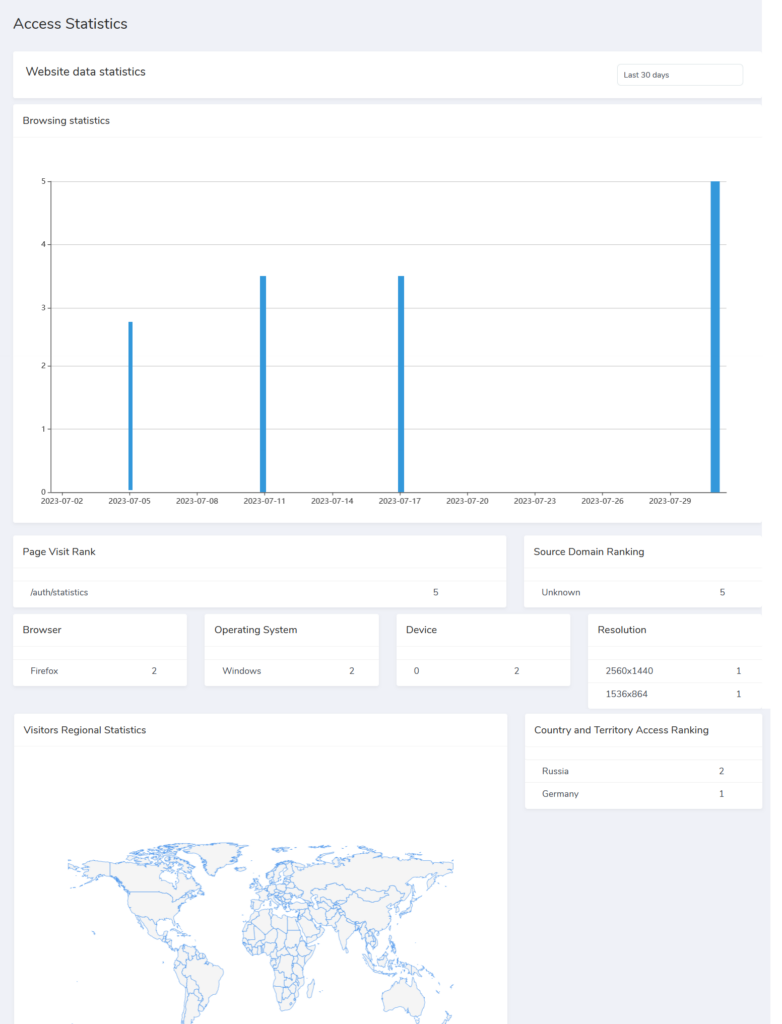
We’ve added the feature to the manager Funded dashboard to view the access statistics of users visiting the dashboard. Now the manager of a Prop Trading firm can see the following data:
- Number of users viewing panel at the moment
- Page visit rank
- Source domain ranking
- Browsers and devices from which traders opened the panel
- Operating systems used by traders
- Screen extension
- Breakdown by territory and country
- Display of statistics by country on a map
This data is displayed for the selected period of time: 24 hours, 3 days, 7 days, 30 days, 90 days.

With this feature, you can get more information about the most active traders who are working with your prop trading panel, determine the times at which the most users view the dashboard, as well as other analytical information about dashboard users.
Stay tuned and follow us at Facebook and Twitter!
Try our demo version of our all-in-one analytics solution filled with the most important data here.


